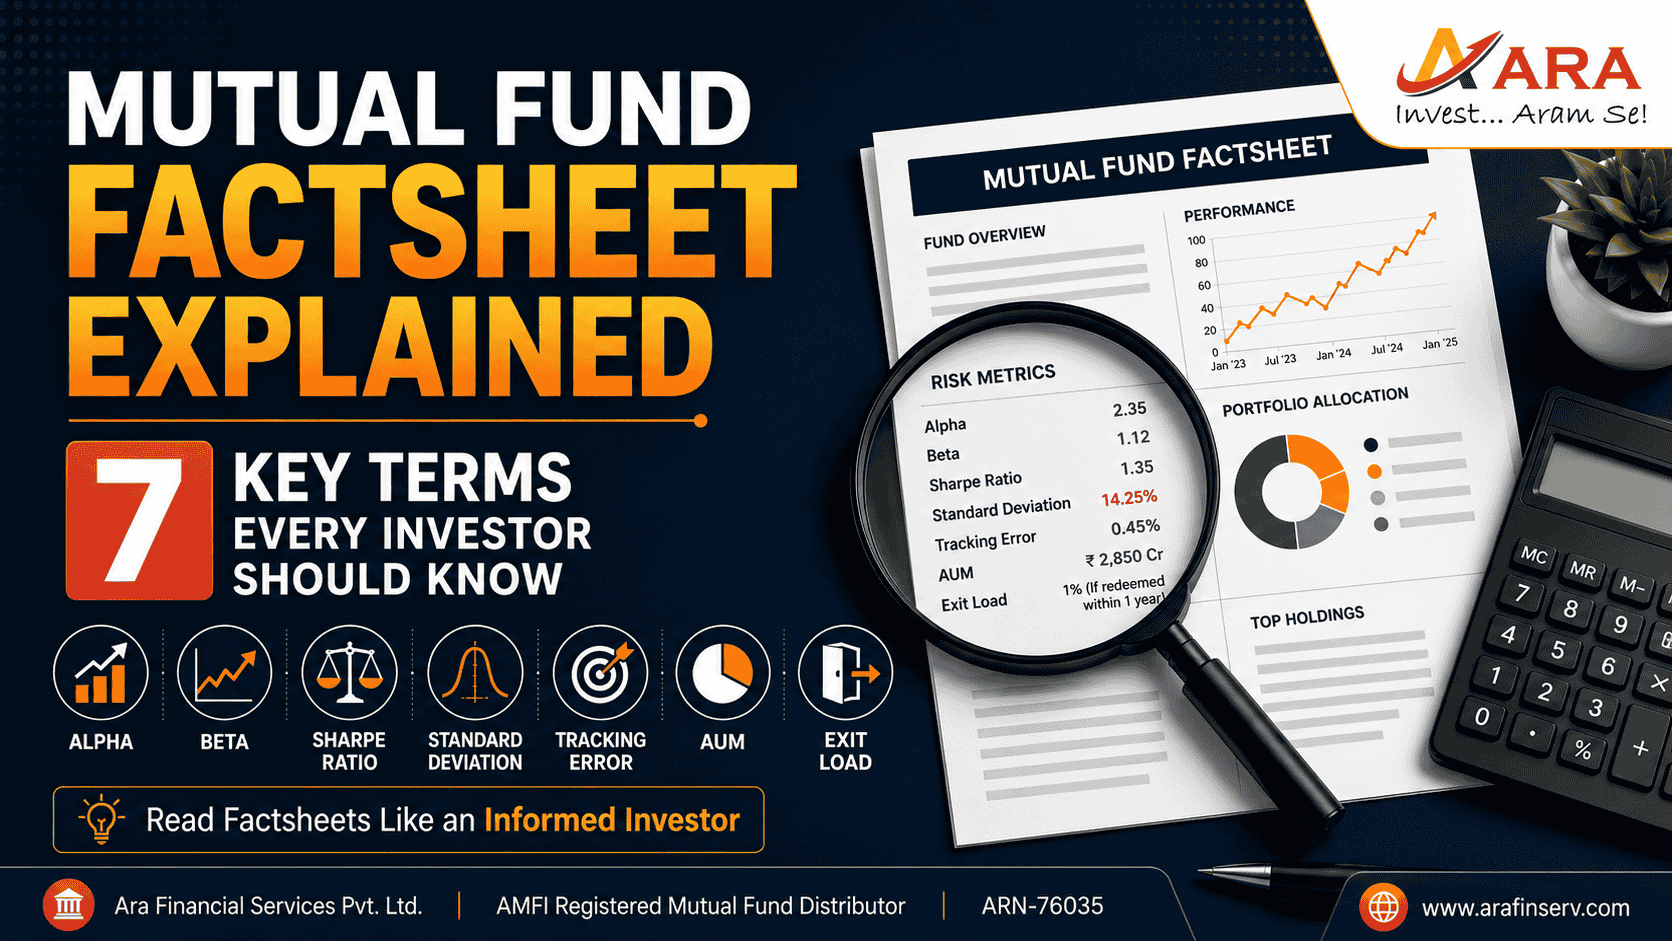
Mutual Fund Factsheet Explained: 7 Key Terms Every Investor Should Know
Have you ever opened a mutual fund factsheet and felt like you accidentally stepped into a finance textbook?
You’re not alone. I hear it constantly from my clients. The moment they spot words like alpha, beta, or Sharpe ratio, they close the document and move on. I completely understand the instinct.
But here’s what I’ve noticed over the years: the investors who take a little time to understand even two or three of these terms almost always make better decisions than those who rely purely on past returns or a friend’s tip.
These metrics aren’t designed to intimidate you. They’re designed to tell you a story about risk, about reward, and about whether a fund is doing what it promises.
Let’s break each one down in plain language.
- Alpha – The Fund Manager’s Report Card (for the given period)
Alpha answers one straightforward question: Did the fund perform better or worse than expected, given the risk it took?
- Positive alpha (say, +2) means the fund outperformed expectations.
- Negative alpha means it fell short.
A simple way to picture it: if the broader market returned 10% this year and your mutual fund returned 12%, that extra 2% is the alpha. It’s the portion of your return that came from the fund manager’s skill, not just from markets going up.
Alpha tells you whether you’re paying for genuine expertise or just riding the market wave.
- Beta – How Wild Is the Ride?
Beta measures how much a fund’s value moves in response to market movements.
- Beta = 1 → moves exactly in line with the market
- Beta > 1 → more volatile than the market
- Beta < 1 → less volatile than the market
Here’s a practical example: a fund with beta 1.2 will likely rise 12% when the market rises 10%. But it will also fall 12% when the market falls 10%.
Beta is your early warning system for risk. The higher the beta, the bumpier the journey. If market swings make you nervous, you’re probably better suited to lower-beta funds.
- Sharpe Ratio – Was the Risk Actually Worth It?
This is arguably the most useful number on any mutual fund factsheet.
The Sharpe ratio tells you how much return you earned per unit of risk you took. Think of it as a quality check on returns.
Here’s an analogy: imagine two funds, both returning 12% last year. One delivered those returns smoothly – steady, consistent, no drama. The other swung wildly – up 25% one quarter, down 15% the next. Both arrived at the same destination, but via completely different roads.
The smoother fund will have the higher Sharpe ratio. And for most investors, that smoother journey matters more than people realise.
When two funds offer similar returns, the one with the higher Sharpe ratio is almost always the better choice.
- Standard Deviation – How Predictable Are the Returns?
Standard deviation measures how much a fund’s returns swing around the average over time.
Low standard deviation = stable, consistent returns.
High standard deviation = unpredictable, up-and-down returns.
A concrete example makes this clearer:
- Fund A annual returns: 10%, 11%, 9%, 10% → Low standard deviation. Steady and predictable.
- Fund B annual returns: 5%, 20%, -3%, 15% → High standard deviation. Volatile and unpredictable.
Both might average around 10%, but your experience of holding them is completely different.
If you’re investing for a near-term goal or if market volatility disrupts your sleep, lower standard deviation funds are worth prioritising.
- Tracking Error – Is the Index Fund Actually Following the Index?
This metric is especially critical if you invest in index funds or ETFs.
An index fund has one job: replicate a benchmark index as closely as possible. Tracking error measures how well it does that job.
- Low tracking error → the fund closely mirrors its benchmark
- High tracking error → the fund is drifting away from the index it’s supposed to follow
Example: if the Nifty 50 returns 10% but your Nifty index fund returns 9.5%, that 0.5% gap contributes to the tracking error.
When you invest in an index fund, you’re paying for simplicity and accuracy. A persistently high tracking error defeats the entire purpose.
- AUM (Assets Under Management) – How Big Is This Fund?
AUM is simply the total amount of money a fund is managing at any given point.
A ₹50,000 crore fund is operating at a very different scale than a ₹500 crore fund. Neither is inherently better. But the size gives you useful context.
A very large fund may struggle to move nimbly, especially in mid- or small-cap stocks where liquidity is limited. A very small fund may lack the stability and operational depth that larger funds offer.
Don’t use AUM as a verdict. Use it as context – one piece of a larger picture.
- Exit Load – The Cost of Leaving Too Early
Exit load is a fee charged when you redeem your mutual fund units before a specified period, typically one year.
Example: a 1% exit load means that if you invest ₹1 lakh and withdraw within a year, you pay ₹1,000 as an exit charge.
It’s not a penalty designed to trap you. It’s a product feature that nudges investors to stay invested through short-term volatility instead of panic-selling, which can be harmful for them to create long term wealth.
Exit load is the fund’s quiet way of reminding you: stay the course. Time in the market matters more than timing the market.
Putting It All Together
When you look at a mutual fund, don’t just chase the highest return number on the factsheet. Read it like a short story about risk and reward:
- Alpha → Is the fund manager genuinely adding value?
- Beta & Standard Deviation → How volatile is this fund’s journey?
- Sharpe Ratio → Is the return worth the risk I’m taking?
- Tracking Error → Is this index fund doing its job accurately?
- AUM → Is this fund the right size for its investment strategy?
- Exit Load → What does it cost me if I need to exit early?
You don’t need to memorise all of this overnight. Even understanding two or three of these metrics puts you meaningfully ahead of most retail investors who pick funds purely based on a one-year return chart or a WhatsApp forward.
Start small. Stay curious. Over time, what once looked like an intimidating finance textbook will start to feel like a familiar conversation about your own money.

Pratik Vora is a Certified Financial Planner and Associate Partner at Ara Financial Services. He have more than two decade’s experience in Banking & Financial Services Industry.